

iNetGrow Software Demonstration
This quick demo illustrates how you can install and use the iNetGrow software to connect to a controller at the iNetGrow site.
Installation
Download the iNetgrow Software installation file. This is an executable file. Your browser may ask you whether you want to run this file from the site or to save it on to a local disk. If you choose to save it locally, double click on it to run it.
Setup_iNetGrow.exe will instruct you through the installation process. The installation process places shortcuts in the menu or on the desktop.
Running the Program
Start the iNetGrow software in Windows either by double clicking on one of the icons or by selecting it from the programs menu.
Specifying Controller
The first time you run the iNetGrow software, you will be asked to add controllers to the list.
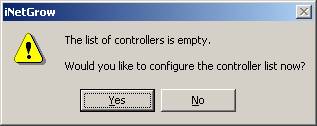
If you have a controller on your Local Area Network (LAN), then specify its IP address. In this tutorial, we will connect to a controller at the iNetGrow site. Click the “Yes” button. This invokes the “Setup Wizard” as shown below.
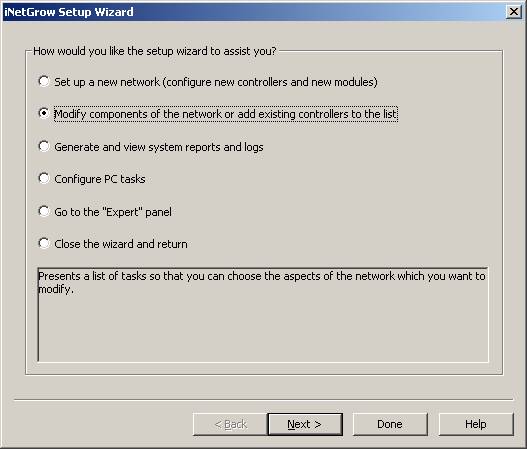
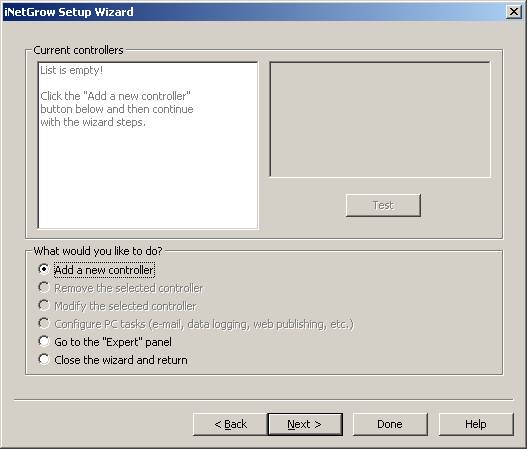
The first option (Set up a new network) allows you to configure all components of a system from the beginning. Since we are connecting to an existing controller that has already been configured, select the second option (Modify components of the network or add existing controllers to the list). Click the “Next” button. You are presented with the controller list, which is currently empty. Select the first option (Add a new controller) and click the “Next” button.
There are several ways to add controllers to the list. You may click the “Help” button to read more about these options. In this tutorial, we specify the controller by its URL and port number. Type in the URL as “inetgrow.dyndns.org” and the port number as “8451.” Note that there is a colon (‘:’) between the URL and the port number, as shown below.
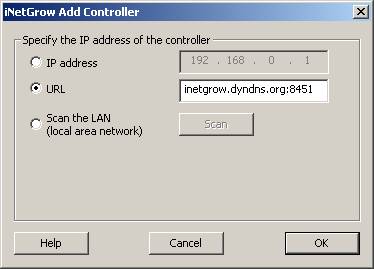
Click the “OK” button to close this dialog. You may test the connection by clicking on the “Test” button. This retrieves information about the controller and displays it in the dialog, next to the list of controllers.
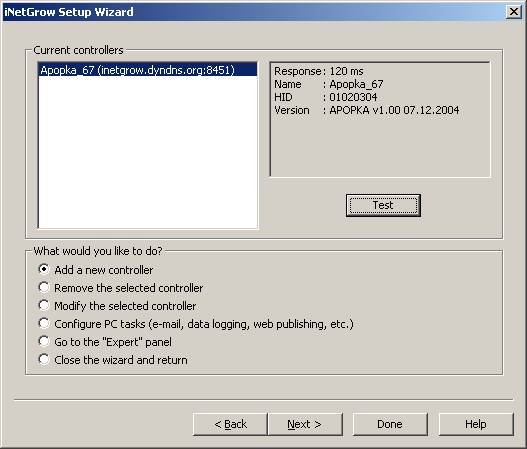
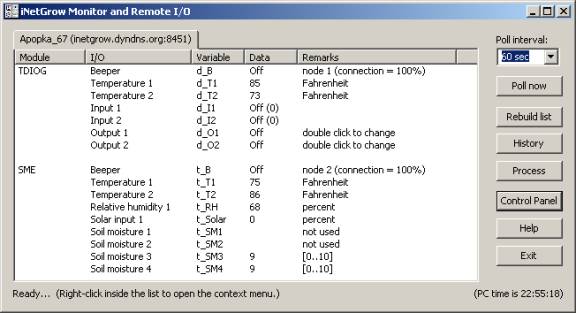
Since the controller and the modules connected to it are already configured, the remaining steps of the setup wizard are not needed. Click the “Done” button to close the dialog. When the setup wizard dialog is closed, the Monitor and Remote I/O window opens. Here you can see the current values of the inputs and outputs. Since there is only one controller in our list, there is a single tab. If you have several controllers, information about each controller would be placed under a different tab.
Viewing Logged Data
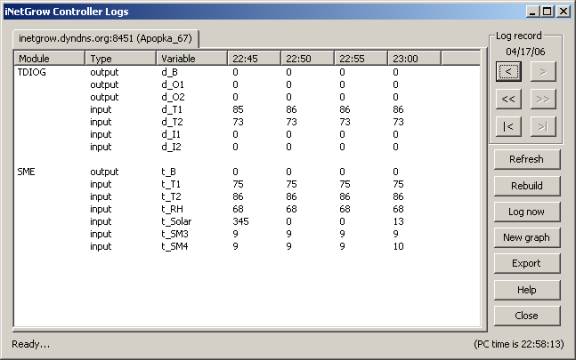
Click the “History” button to view the data that is being logged by this controller.
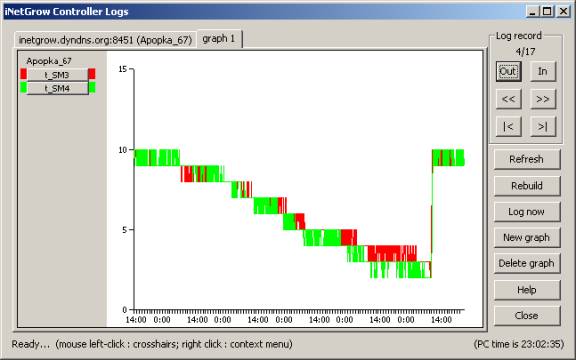
If you would like to see the data displayed as a graph, click the “New Graph” button. Select a few variables and placed them in the list on the right by clicking on the “>>” button. Click the “OK” button to close this dialog.
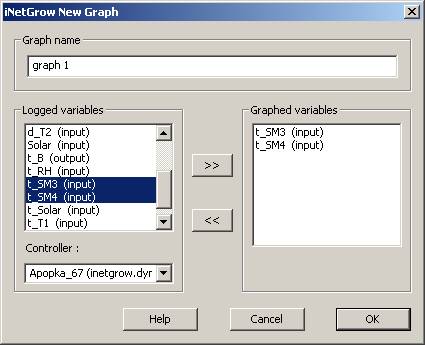
Once the dialog is closed, the PC asks for data from the controller. This takes a little time. When done, the graph is displayed. It is recommended that you click the “Help” button at various steps to learn more about the many features of the iNetGrow software.
Viewing Process Information
The controller is running a script to perform automated tasks. In the Monitor and Remote I/O dialog, click on the “Process” button to view the current values of the variables and parameters as they are used by the script.
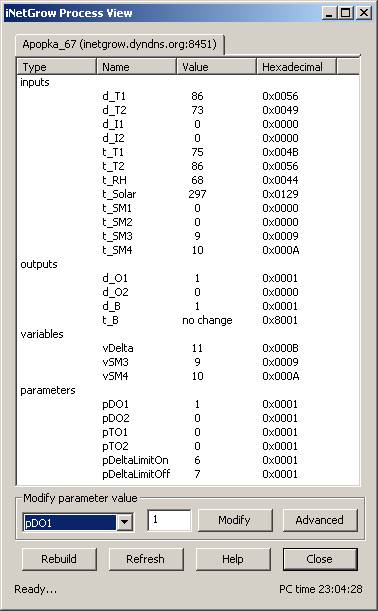
Click on the “Help” button to learn more about the many features of the software.
© 2003-2006 Rigel Corporation, all rights reserved.